Hi community. @fbeghini @franzosa @f.asnicar @NSegata
I have profile metagenome with Metaphlan3. I am using krona in galaxy for visualisation using the profile output file as the input for Krona. Although I am getting a html file there (around 250kb), when I open them, it opens as an empty tab. I am not getting the expected pie chart.
This is my profile file
biobakery.txt (148.5 KB)
I have also installed krona2.7 in my system and used the following codes:
$python3 metaphlan2krona.py --profile baseline_profile.txt --krona baseline_profile.krona.txt

$ktImportText baseline_profile.krona.txt -o baseline_profile.krona.txt.html
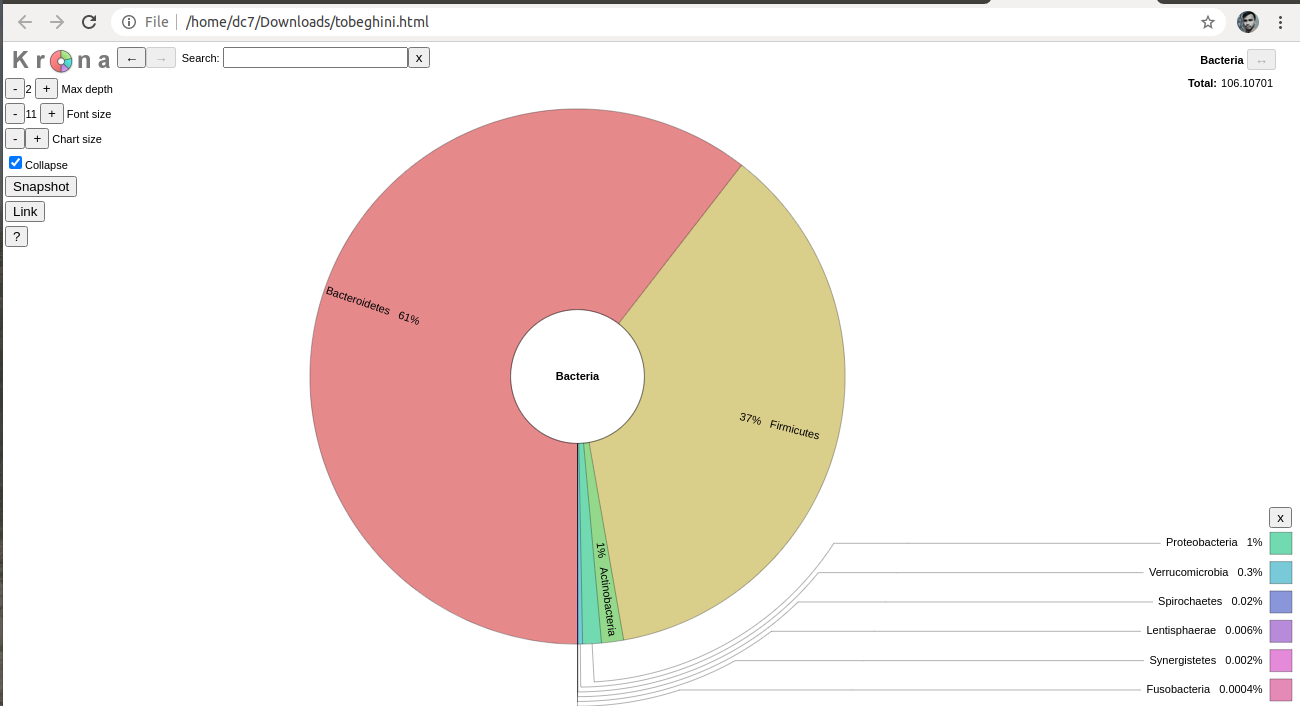
The result is a .html file with a pie chart. BUT, the abundance labelled in the chart is not same as of the abundance profile .txt file.
Can you please help me? I am stucked at this point.
Thanks and regards,
DC7
Using Krona on UseGalaxy, I can generate the piechart without any problem after removing the NCBI_tax_id column and use metaphlan2krona.py. With the same file and the same commands you listed here I was also able to generate the same exact plot with the correct abundancies.
You could check if the abundancies in baseline_profile.krona.txt are the same as baseline_profile.txt
1 Like
Hi Sir@fbeghini!!!
I’m attaching my profile output and the generated html file. Please note that Bacteria abundance in the pie chart is 106.10701 while it is 100 in the text file. Similarly, Firmicutes is in total 38.97291 and 37% of bacteria in pie chart while it is 33.3528 in txt format. discrepency is also with bacteroidetes abundance.
tobeghinii.txt (61.1 KB)
Thanks,
DC7
Ah, okay, now I get what you meant, the total is greater than 100. I’ve fixed the error in the source code, non-species unclassified taxa were also included. You can get the fixed script from the GitHub repo.
1 Like
Okay sir… Thanks a lot. Can you please share the link of the fixed source code?
DC7
If you please don’t mind I have one more query from the profile output file. Krona only runs if we remove the 4th column containing the “additional species…”. But, if we remove that column, aren’t we losing important information?
Thanks,
DC7
You only lose information about other taxonomies, you could merge the species name with the last column of the krona tabular file
Hi:
I tried to use metaphlan2jrona.py but I received this error code:
metaphlan2krona -p BIKE011A_lib513456_7661_2_taxonomic_profile.tsv -k BIKE011A_krona.tsv
Traceback (most recent call last):
  File "/home/microviable/workflows/lib/python3.7/site-packages/metaphlan/utils/metaphlan2krona.py", line 49, in <module>
    main()
  File "/home/microviable/workflows/lib/python3.7/site-packages/metaphlan/utils/metaphlan2krona.py", line 42, in main
    abundance = float(x_cells[-1].rstrip('\n'))
ValueError: could not convert string to float:
Any idea?
Thanks
Hi, has the Value Error been resolved?
I get the same error.
abundance = float(x_cells[-1].rstrip(’\n’))
ValueError: could not convert string to float
Please share.
Thank you!