I’m doing an analysis in MaAsLin and had a couple of questions.
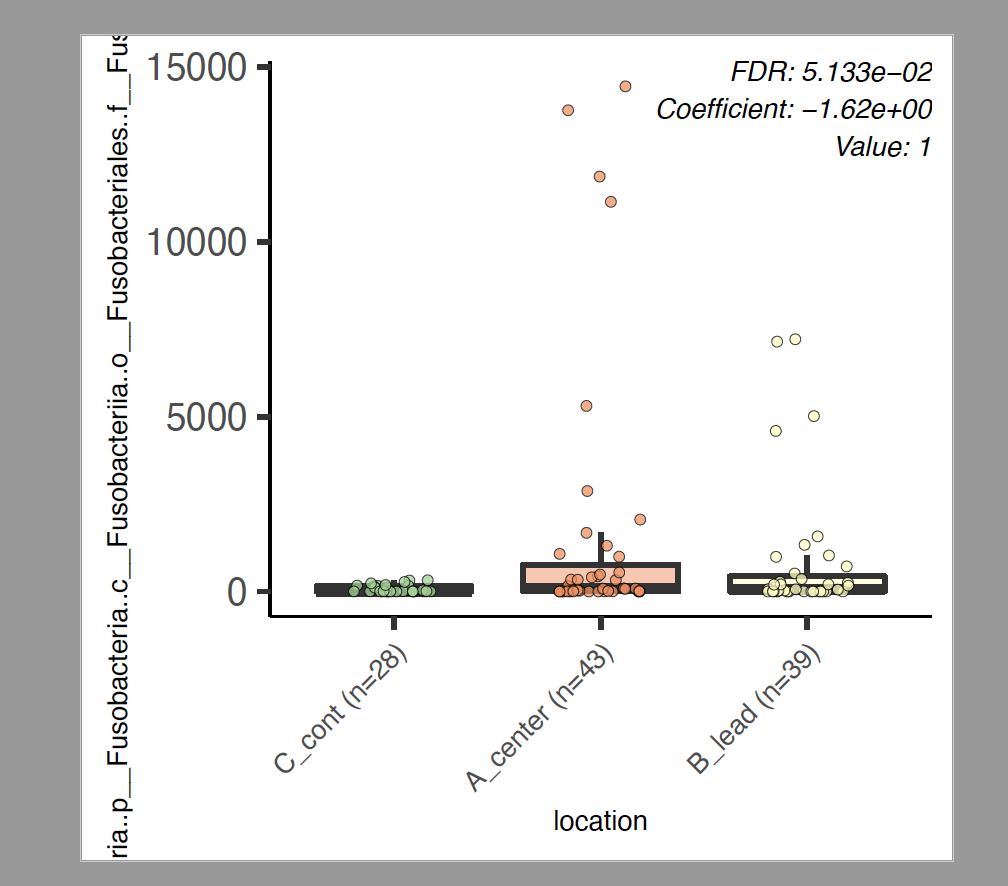
My fixed effect is sample location. I am comparing microbial differences in samples collected from the center and leading edge of tumours to contralateral healthy tissue samples. In my column labeled “location” I have samples labeled as “A_center”, “B_lead” and “C_cont”. I have set “C_cont” as my reference but the output data in the “value” column is listed as 1 and 2 instead of “A_center” and “B_lead”. I am assuming 1 = “A_center” and 2= “B_lead” but want to make sure. Does anyone know how to check. I already looked at the figures but its not obvious. See below attachments for clarifications.
I am using an OTU table with count data. I am using the below code to run my data but the figures that are generated are still in counts i.e. it doesn’t appear to change count data to CSS. Is this expected?
For 1. The value 1 issue is one we are working on - it’s an R bug that (I believe) factors are being converted into nonsense. The plot should have Value: XXX where XXX is the significant variable in the comparison. Without the model output, I can’t say for certain but since the plot has C_cont as the first boxplot I believe it is doing the correct comparisons (by default it should be alphabetical unless you changed the reference, which is what you did here). So my best guess is that it is running as expected given your command.
For 2. Yes, that is expected behavior, MaAsLin plots the raw untransformed data - another update that we are working on in the future version of MaAsLin to allow the user to select what they want for the plots. For now, the data plotted is the input feature table. - This would also apply for @Samantha
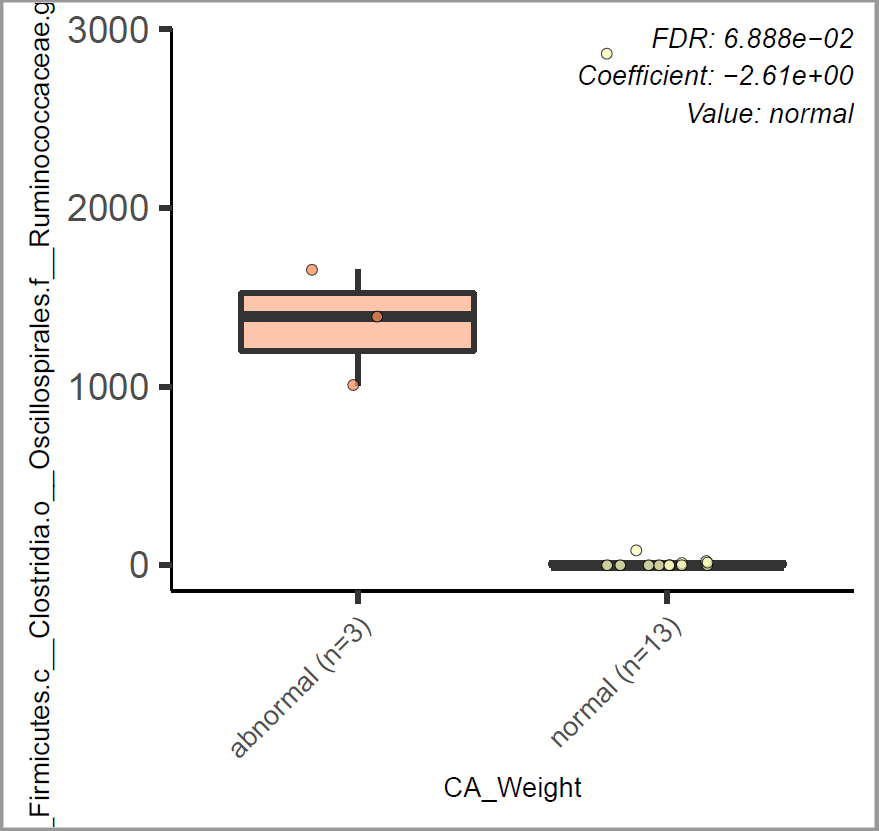
Thanks for answering! I did have a follow-up question on your answer for question one. You said that the plots default to alphabetical unless the reference is changed. I changed the reference for all my categorical variables and the plots (seemed to have) correctly changed the order for all plots except one. Does that mean the model isn’t running properly?
This is another fix we have in the pipeline. Currently, MaAsLin ignores the setting of the reference in 2 level categoricals. So in this case MaAsLin is using abnormal as the reference. If you want to use these data still you can simply flip the sign on the coef, which would change the direction of the association. If you want to check this the numbers should be basically the same if you rename normal to a_normal - for which MaAsLin would then use normal as the reference.