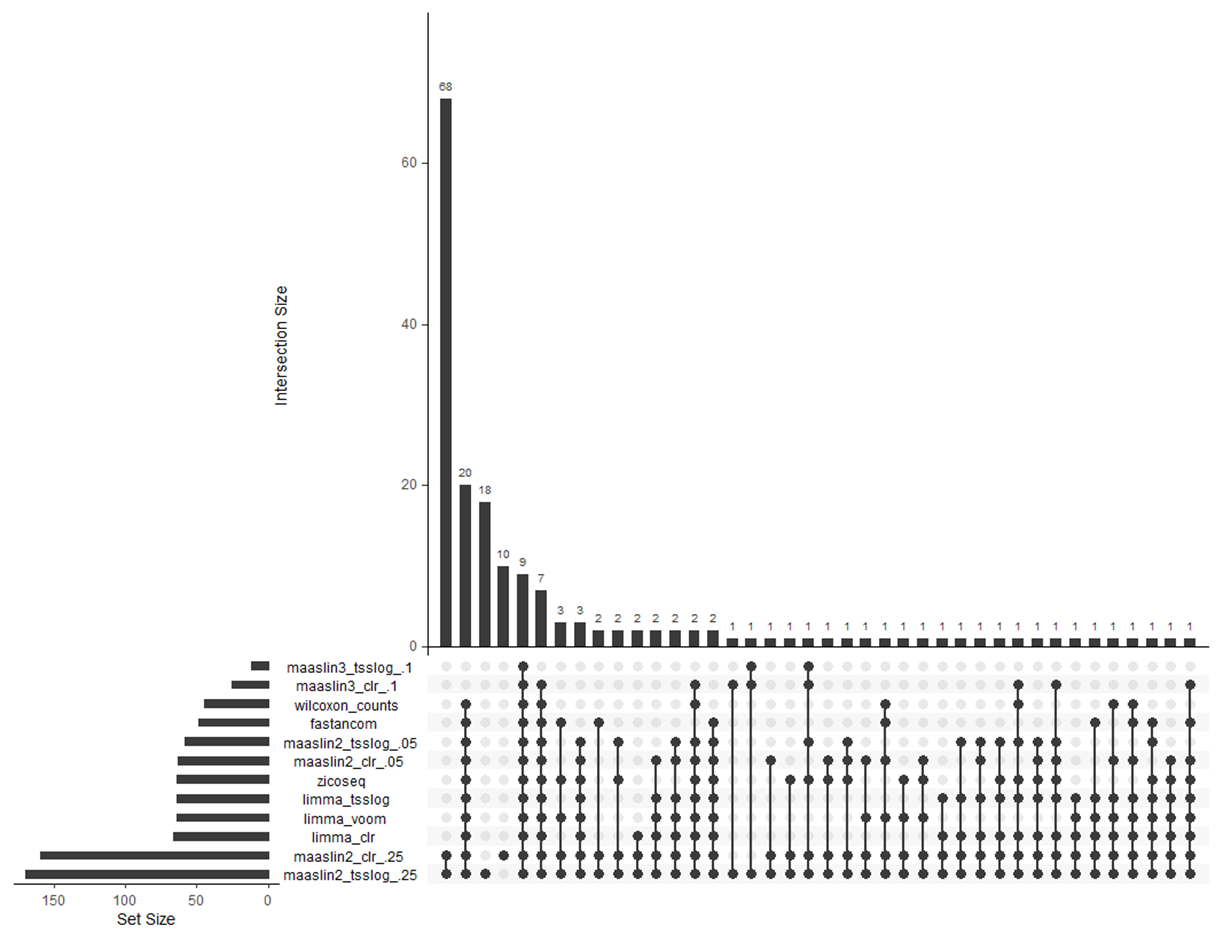
First of all thanks for the developing and maintaining maaslin2 and 3. I routinely use maaslin2 for microbiome analysis and considered switching to another tool and ended up testing a whole bunch of DA tools to see how it behaved in my use case (15 vs 15 samples). Here’s an upset plot of the DA features found (coefs are in agreement across methods)
For maaslin3 I considered DA whatever taxa were either differentially prevalent or differentially abundant (either qval below .1). For maaslin2 I used .25 and .05 as qvalue thresholds. I also used different transfos (e.g. tss log, clr , even voom in conjunction with limma).
Main messages: 20 taxa are found DA by all other state of the art tools, but not maaslin3. 16 taxa are found by all tools (including maaslin3, but there’s a discrepancy between transfos) . So essentially more than half of DA taxa found by all tools are not reported by maaslin3. Looking into the distributions of relative abundances between my two conditions for the 20 taxa not found by maaslin3, typical profile is this:
Sometimes trend is reversed. But essentially, if you have taxa that are exclusive to any of the two branches you compare, it’s not reported as differentially prevalent (maybe on larger sample sizes maaslin3 might detect it , but I do work with such samples sizes on a regular basis, so I wouldn’t use it).
I do not know if this issue is widely relevant, but I just wanted to point it out.
Thanks for sharing this! It’s a nice comparison. For the cases you pointed out, what were the MaAsLin 3 logistic (prevalence) coefficients and q-values? Were they just not significant?
For what it’s worth, there’s also a trans=“PLOG” option you can set that will put small pseudocounts for the zeros and probably make the results come out like the rest.
Hi Will! Yes, the qvals for prevalence were there (and ofc NA for abundance tests) and were high. For the transfos I must admit I didn’t dig into maaslin3 codebase that much and assumed it was doing like maaslin2 did. As far as I get maaslin3 PLOG does is what maaslin2 LOG is doing (i.e. imputing half of the lowest count). here’s the upset with plog, sure enough it recapitulates the 20 missing taxa.
However, I am a still a bit irked that the usual prevalence testing of maaslin3 fails on these cases where a taxa is branch exclusive But anyway, with this plog transfo I have the desired sensitivity, so again, thanks for your help!
Sorry if I missed it somewhere, but what were the actual q-values on the prevalence associations in these few cases? If you had ~15 present and ~15 absent, completely stratified by group, that should still be a pretty significant prevalence effect, even with only ~30 total data points. I just want to make sure we don’t have an issue with the prevalence modeling in linearly separable cases like this.
Hi will, sorry forgot to include. So here are the 16 species where it was found everywhere else but not with maaslin3 CLR/TSSLOG. They were NOT found in one condition, but found in most of the other. Here are the qvalues vs the nb of positive cases
Interesting - yeah, so it must just be a sample size issue. Clearly it was on its way to significant if there were just more non-zeros. That’s pretty similar to what we found in the paper evaluations.
Yeah here the prevalence changes ~75% to 0% are on the edge, probably just below the effect size this sample size can detect. Thank you very much for the input!