Hi,
Since our lab only have sequencing data from 16s sequencing, i’m wondering whether we can still use the pre-trained model (the default one in melonnpan) to predict the metabolite composition?
If it is doable, is it possible to transform the Uniref90 ID to KEGG orthology in the pre-trained model list, so that we can put in our PICRUSt-derived KO list and predict the metabolites?
thank you so much!
1 Like
Hi @danny973 - unfortunately, this feature is not yet supported for the default MelonnPan model. The workaround with the 16S data using the current MelonnPan machinery would be to re-train a model on paired metabolite and microbiome data and use the newly trained model to predict metabolites in new samples.
Hi @himel.mallick, thank you so much for your answer. However, since it isn’t easy to retrieve a great amount of paired data (using amplicon seq) for model training , is it logical if we run the WGS data, regroup the Uniref90 ID to KO, then train the model with KO list and the metabolites, finally, we predict the metabolites with our own KO (derived from PICRUSt)? Than you!
Hi @danny973 - your approach makes sense. Let me know how it turns out. We will make sure to incorporate non-UniRef90 functionality in the next iteration of the software.
@himel.mallick Thanks a lot! By the way, may I get the " CPM-normalized gene family abundance" which is the input file for the “regroup” function of Humann2 from anywhere? Thank you so much for your generosity!
Hi @danny973 - I would ask this question in the HUMAnN forum.
@himel.mallickThank you! I would like to get the one which was used in the default model-training (the IBD study).
Hi @danny973 - please reach out to the first author of the PRISM paper who might have access to the most up to date CPM-normalized gene family abundances. Thanks!
@himel.mallick Thank you so much for your help! I’ll contact the author. Best regards!
Hello @himel.mallick
I’ve received the RPK data of the PRISM study from the author, thank you so much for the suggestion. However, I’m wondering whether I can get the metabolites profile (400+ metabolites?) used in the training of the default MelonnPan as well? Sorry, I just recently noticed that the metabolite profile list on the Github (with only 80+ metabolites) isn’t the one used to train the default model.? I only saw the full metabolites profile (8000+ metabolites) from the original Paper (the PRISM study).
Thank you so much!
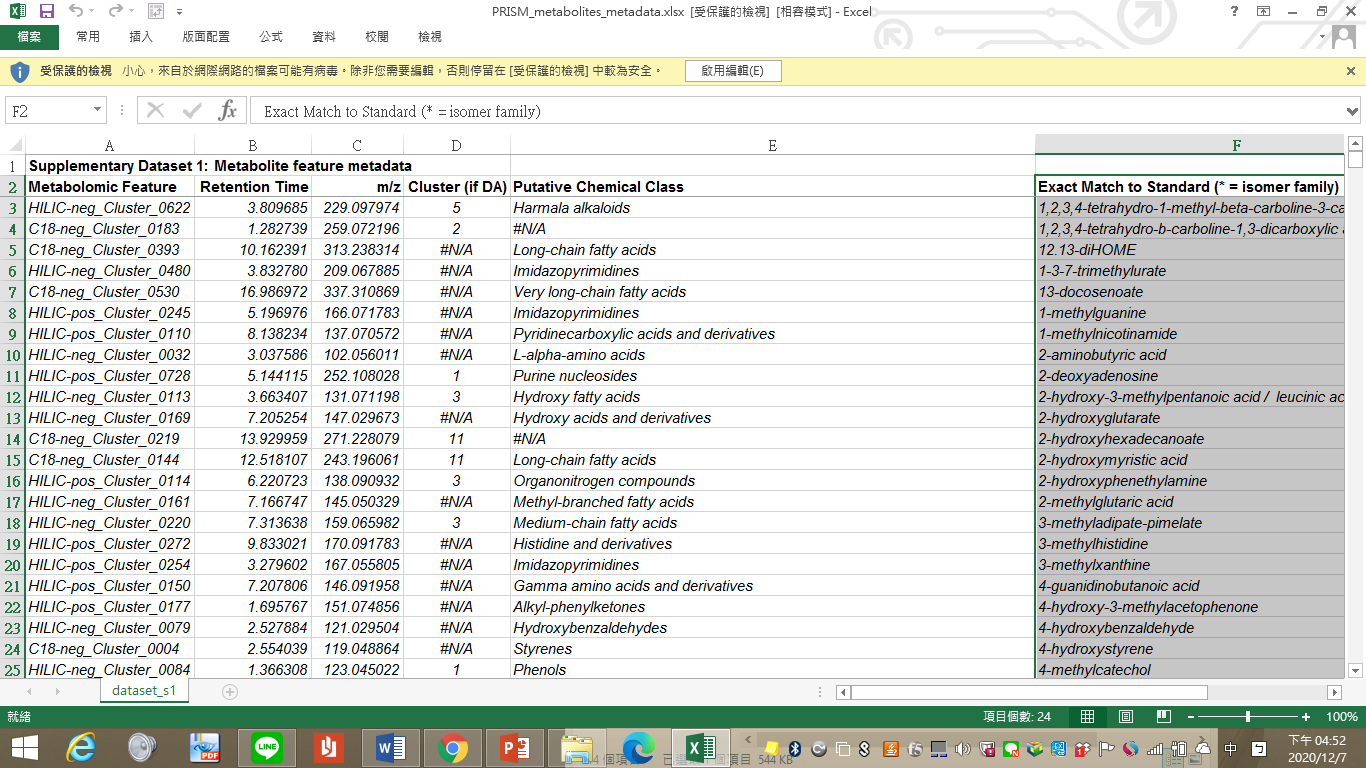
I’ve just noticed that the metabolite feature metadata I downloaded form the original PRISM paper (supp dataset 1) contains a column "Exact matched to standard) and the number of metabolites is 466 (the exact same number stated in the method section in MelonnPan paper) (figure attached below). I think that those were the metabolites being used to train the default MelonnPan?
Thank you!
Hi @danny973 - we actually trained all available metabolites (post-QC) regardless of their Exact matched to standard status and later categorized these predictions based on this column as shown in the Supplementary Figure 1 of the MelonnPan paper. For the default trained model included in the software, we only included those compounds with unique names to resolve any ambiguity around the non-unique compound names.
Hello , @himel.mallick
I’m so sorry for bothering you again and really appreciate your kindness. So I shall train MelonnPan with all the metabolites passing QC then categorize them with “Exact matched to standard” after training.
I’ve normalized the RPK to CPM, and regrouped Uniref90 to KO (8% grouped 1+ times, 0.1% grouped 2+ times).
I would like to ask for your comments and suggestions for the following steps. Before training, I need to normalize the gene abundance (KO) again with the –renorm function in Humann2, then discard features with <0.01% abundance (is it the abundance compared with features “within a sample” or “among all the samples”?) in >=10% samples? For metabolites, what method shall I take to normalize them? After normalizing the metabolite features, I will discard features with <0.01% abundance in >=10% samples? Next, I can train the MelonnPan with the quality-controlled and normalized gene/metabolite features?
Thank you so much for your patience and generosity!
Hi @danny973 - your workflow looks correct. For filtering both these tables, you can simply use the steps discussed here. Thanks!
Hello @himel.mallick,
Thanks a lot! So, after normalizing both metabolites and genes using -renorm function in Humann2 (<-- I’m still not sure whether this is correct?), I can filter them using the function you provided in the previous reply. Please let me know if I’m right? Thank you so much!
Hi @danny973 - sorry for the confusion. The normalization that I was alluding to is called the TSS (Total Sum Scaling) normalization which can be applied to both these tables. The renorm function is essentially doing a similar normalization but it’s geared towards HUMANn2 gene tables. As you need TSS-normalized data (proportional data ranging between 0 and 1) for MelonnPan, you can approximately do the following for your purpose:
- Get the normalized gene table using the
renormfunction from HUMANn2 - TSS-normalize the gene table (so that it’s proportional between 0 and 1)
- TSS-normalize the metabolite table (so that it’s proportional between 0 and 1)
- Apply filtering to both these tables to remove features with almost no variance
- Train a new MelonnPan model and predict in new samples
Hope this helps!
Hello @himel.mallick,
Thank you so much for your explanation, it helps a lot! I think I can start the following steps! Thanks!
Hi @himel.mallick,
I’ve successfully normalized both genes and metabolites and filtered low quality genes as well. However, I ran into problem filtering low quality metabolite features. The R scripts are as followed:
abd_threshold = 1e-04
prev_threshold = 0.1
Metabolite_full_relabd_filtered ← Metabolite_full_relabd[, colSums( Metabolite_full_relabd > abd_threshold) > nrow(Metabolite_full_relabd)* prev_threshold]
resulted in the error response:
Error in
[.data.frame(Metabolite_full_relabd, , colSums(Metabolite_full_relabd > :
undefined columns selected
I’ve googled for solution, but haven’t found one to solve it. May I ask you for suggestion? Thank you so much!
Hey @danny973 - the code assumes that the features (metabolites or genes) are in the columns. If the features are in rows, you have to do something like this:
Metabolite_full_relabd_filtered <- Metabolite_full_relabd[rowMeans( Metabolite_full_relabd > abd_threshold) > prev_threshold, ]
Does it make sense?
Hi @himel.mallick,
I did arrange the features in columns and samples in rows.
I’ve solved the problem by simply change the name of metabolites to M1, M2…, though I have no idea why. I’m currently in the process of training! Thanks a lot for your help!